How I doubled throughput on my key-value store in Go using sharded maps
Using CPU profiling to find and fix lock contention in EmberDB, my Redis-compatible key-value store.
A few weeks ago, I wrote EmberDB, a Redis-compatible key-value store in Go with a cluster mode. I spent the last week optimizing it. I wanted to push it past the first working version, and I also wanted an excuse to get deep into CPU profiling.
The optimizations I made gave me up to a 2.5x throughput gain and about a 2.25x drop in latency for certain commands. Here's how I got there and what I learned along the way.
If you'd much rather watch a video, here's the link. You can also watch part 1 here.
The benchmarking setup
Once the implementation was done, I wanted to ask whether I could improve it further. As I mentioned in my previous video, the first version was pretty hacky because I wanted it working before I worried about performance. So with Codex's help I set up a benchmarking suite and a profiling suite.
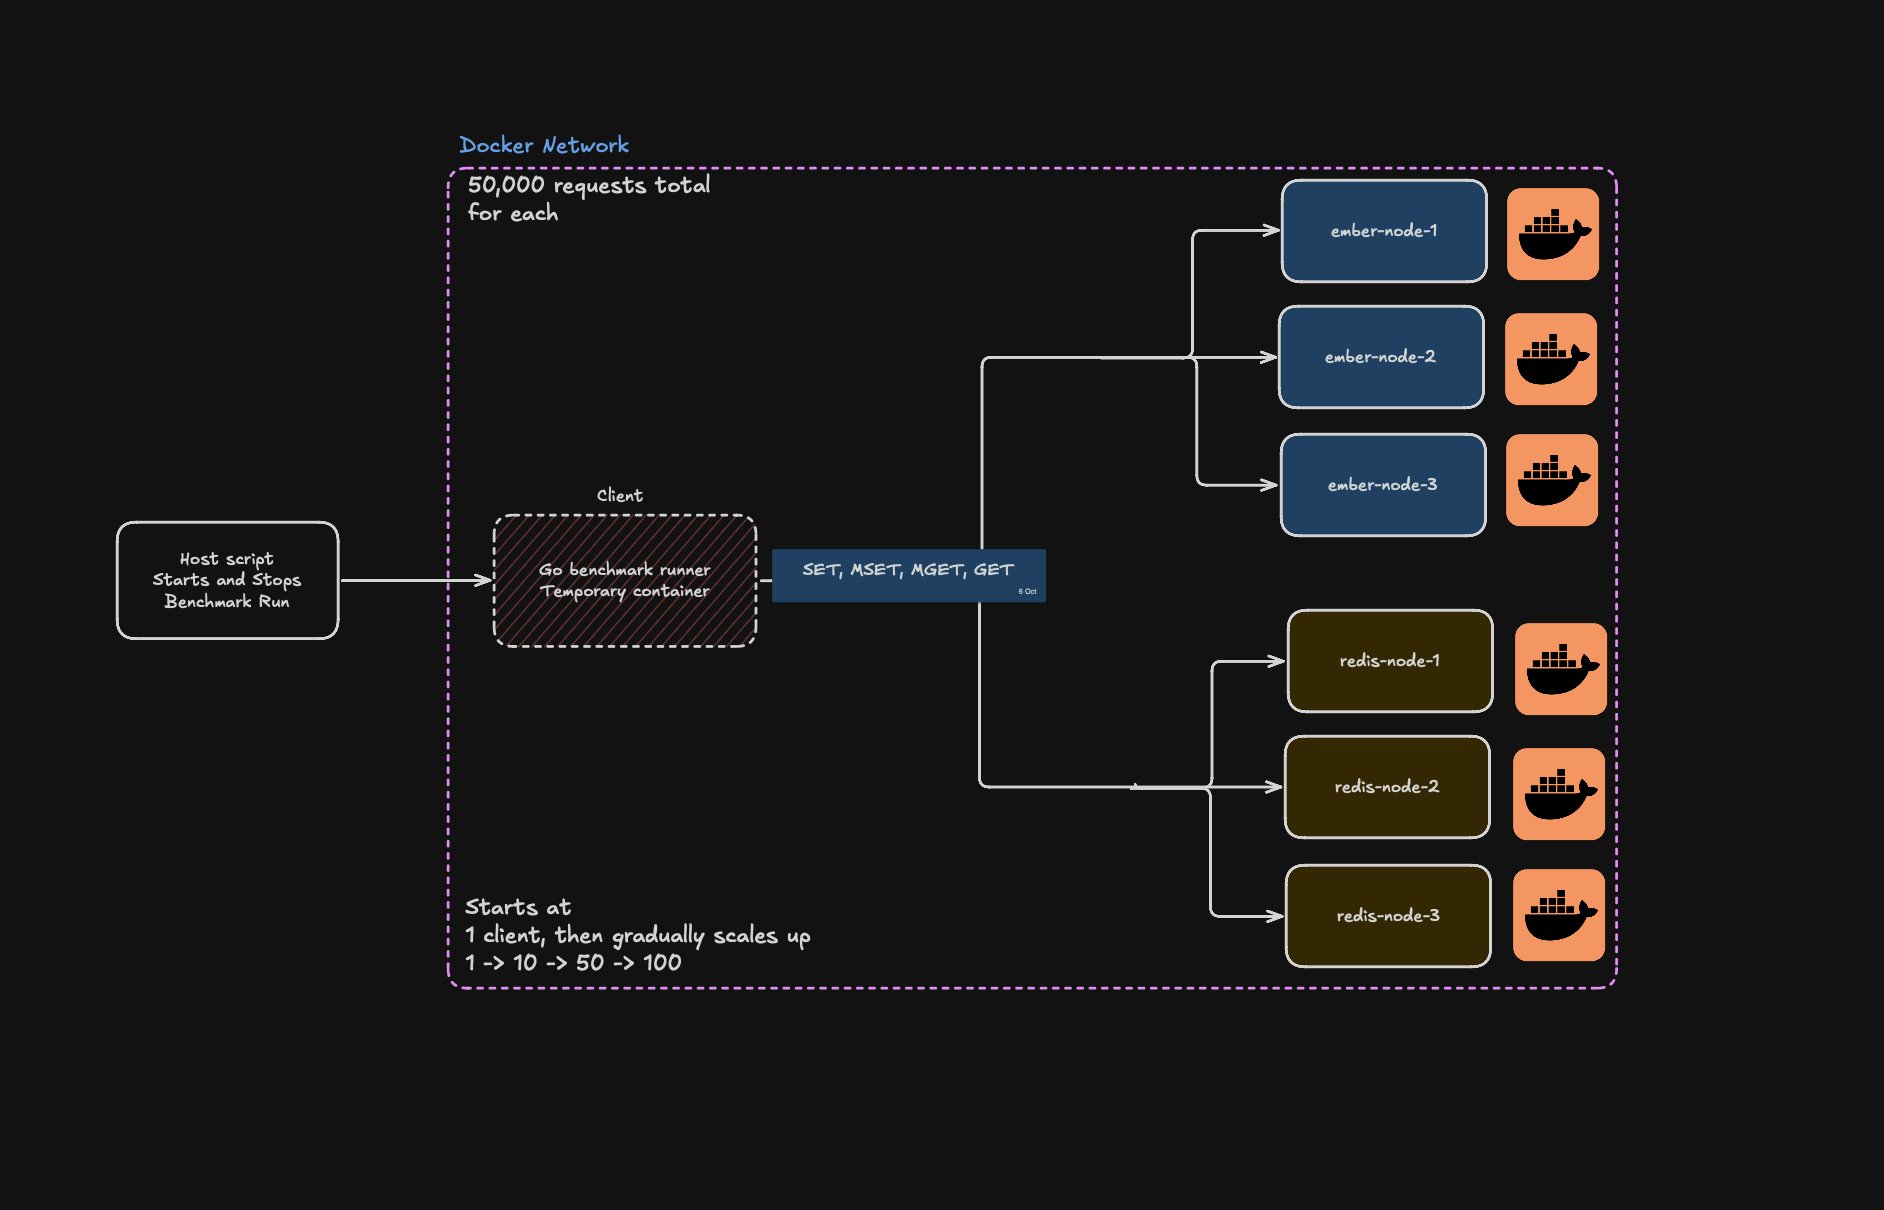
Everything runs on my Mac. A script spins up a Docker network with a temporary client container inside it. That client sends four commands (GET, SET, MGET, MSET) to two clusters: a 3-node Redis cluster and a 3-node Ember cluster. Each cluster gets 50,000 requests in total, and concurrency starts at 1 client and scales to 10, 50, then 100. I tried going past 100 concurrent clients, but my machine became the bottleneck and froze or crashed, so I capped it there for now. A full run takes about half an hour.
It measures two things:
- throughput (operations per second)
- latency (time between sending a request and getting the right response back).
I also built a test suite to check correctness. I ported Redis's tests for these four commands into Go and added a few of my own to catch concurrency bugs, since Redis executes commands on a single thread and Ember executes them on many.
I originally ran 2,000 requests in total, and the results varied too much between runs for both Redis and Ember. Bumping it to 50,000 fixed that.
There's one real limitation here. The client runs on the same machine as the containers, and Redis's own benchmarking docs say that's not ideal. I don't have a second laptop and didn't want to pay for a VPS before knowing the setup would work.
This did add some variance, so I ran enough repetitions that the numbers I talk about here sit close to the mean. I also tried CPU pinning through Docker Compose, but with the way macOS and Docker handle CPUs (at least as I understand it), it made no real difference and gave me one more variable to worry about, so I dropped it.
The bottleneck
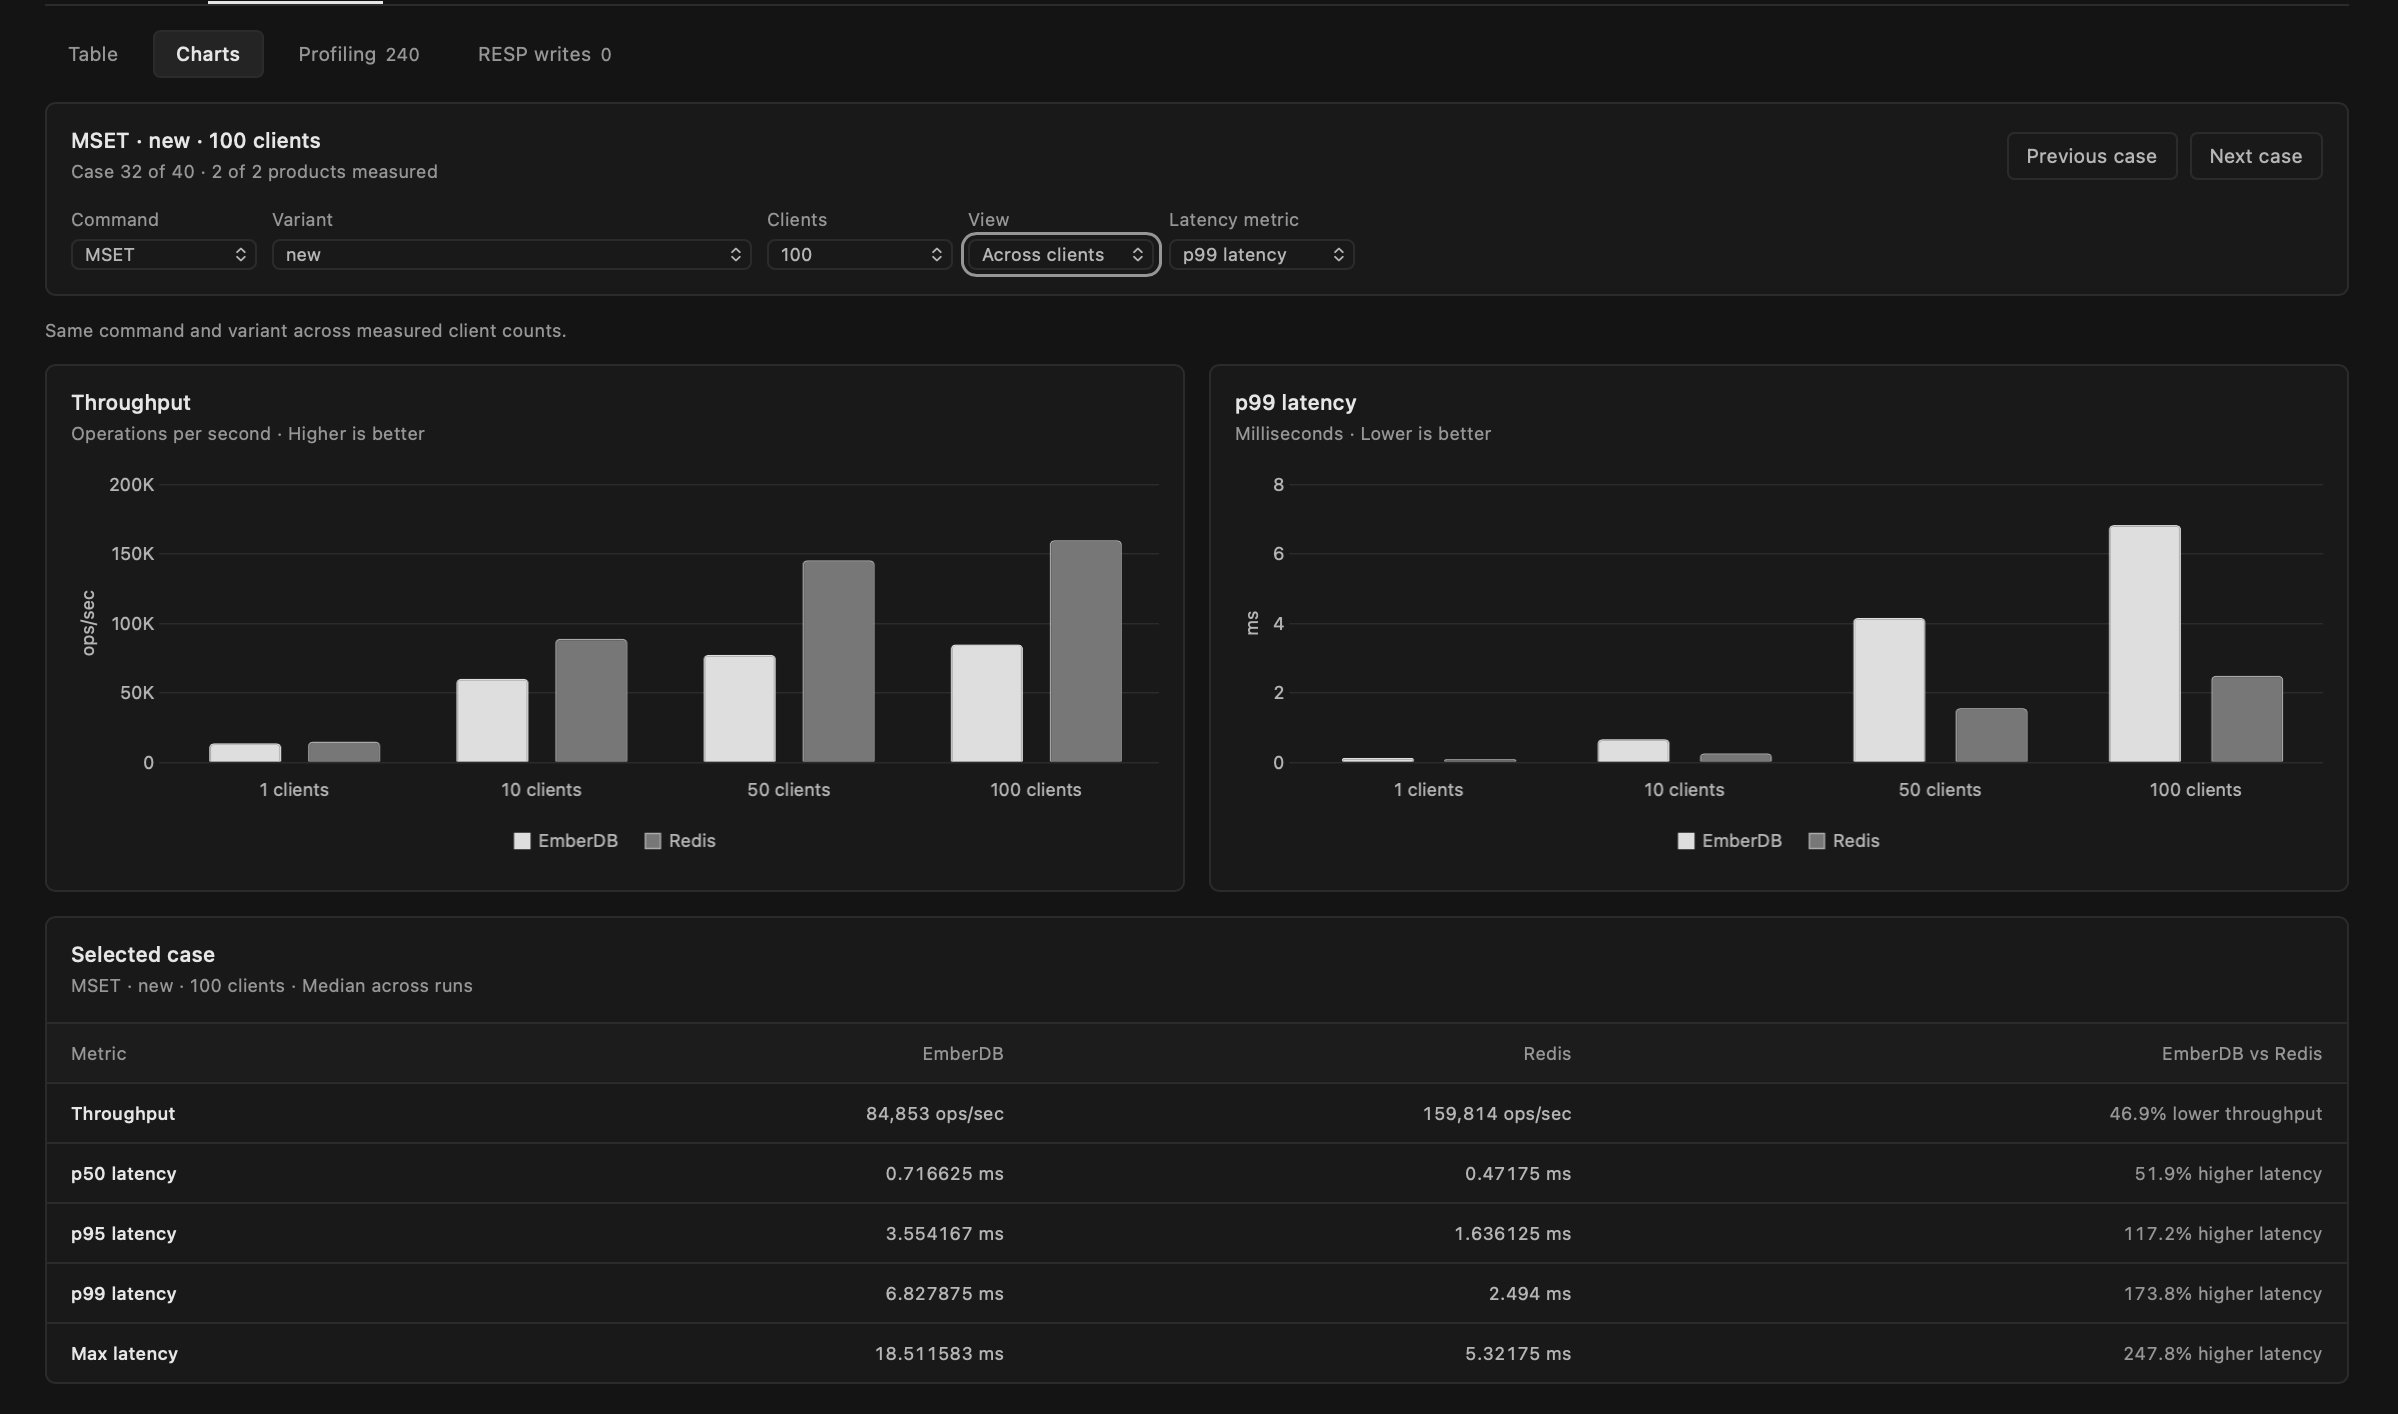
These charts are for MSET on new keys. Going from 50 to 100 clients, Redis's throughput keeps climbing while Ember's pretty much flatlines. Latency is worse. Ember's P99 latency climbs almost exponentially to about 7ms, while Redis tops out a little under 2.5ms.
The wrong turn: syscalls
I spent 2 to 3 days convinced this was a syscall problem. I'd read a blog post saying unbuffered writes kill throughput and latency, and the profile showed a function that ended up in a write syscall, which meant a lot of time was going into small writes that weren't being batched.
I forked the networking library internally so I could dig into it, and that's when it clicked that the library was fine. The cost came from my architecture. Redis runs commands on a single thread. Ember spins up a goroutine per client connection, which means I need to keep things consistent across goroutines. On top of that, I don't support pipelined requests yet, and the benchmark wasn't pipelined either, so every command was one request and one response, which pays the full write cost each time.
Fixing that properly meant either rewriting Ember as a single-threaded event loop or building pipelining as a whole new feature. Both were bigger refactors than I wanted for this, so after a few days of staring at those graphs I started looking elsewhere.
The actual problem: lock contention
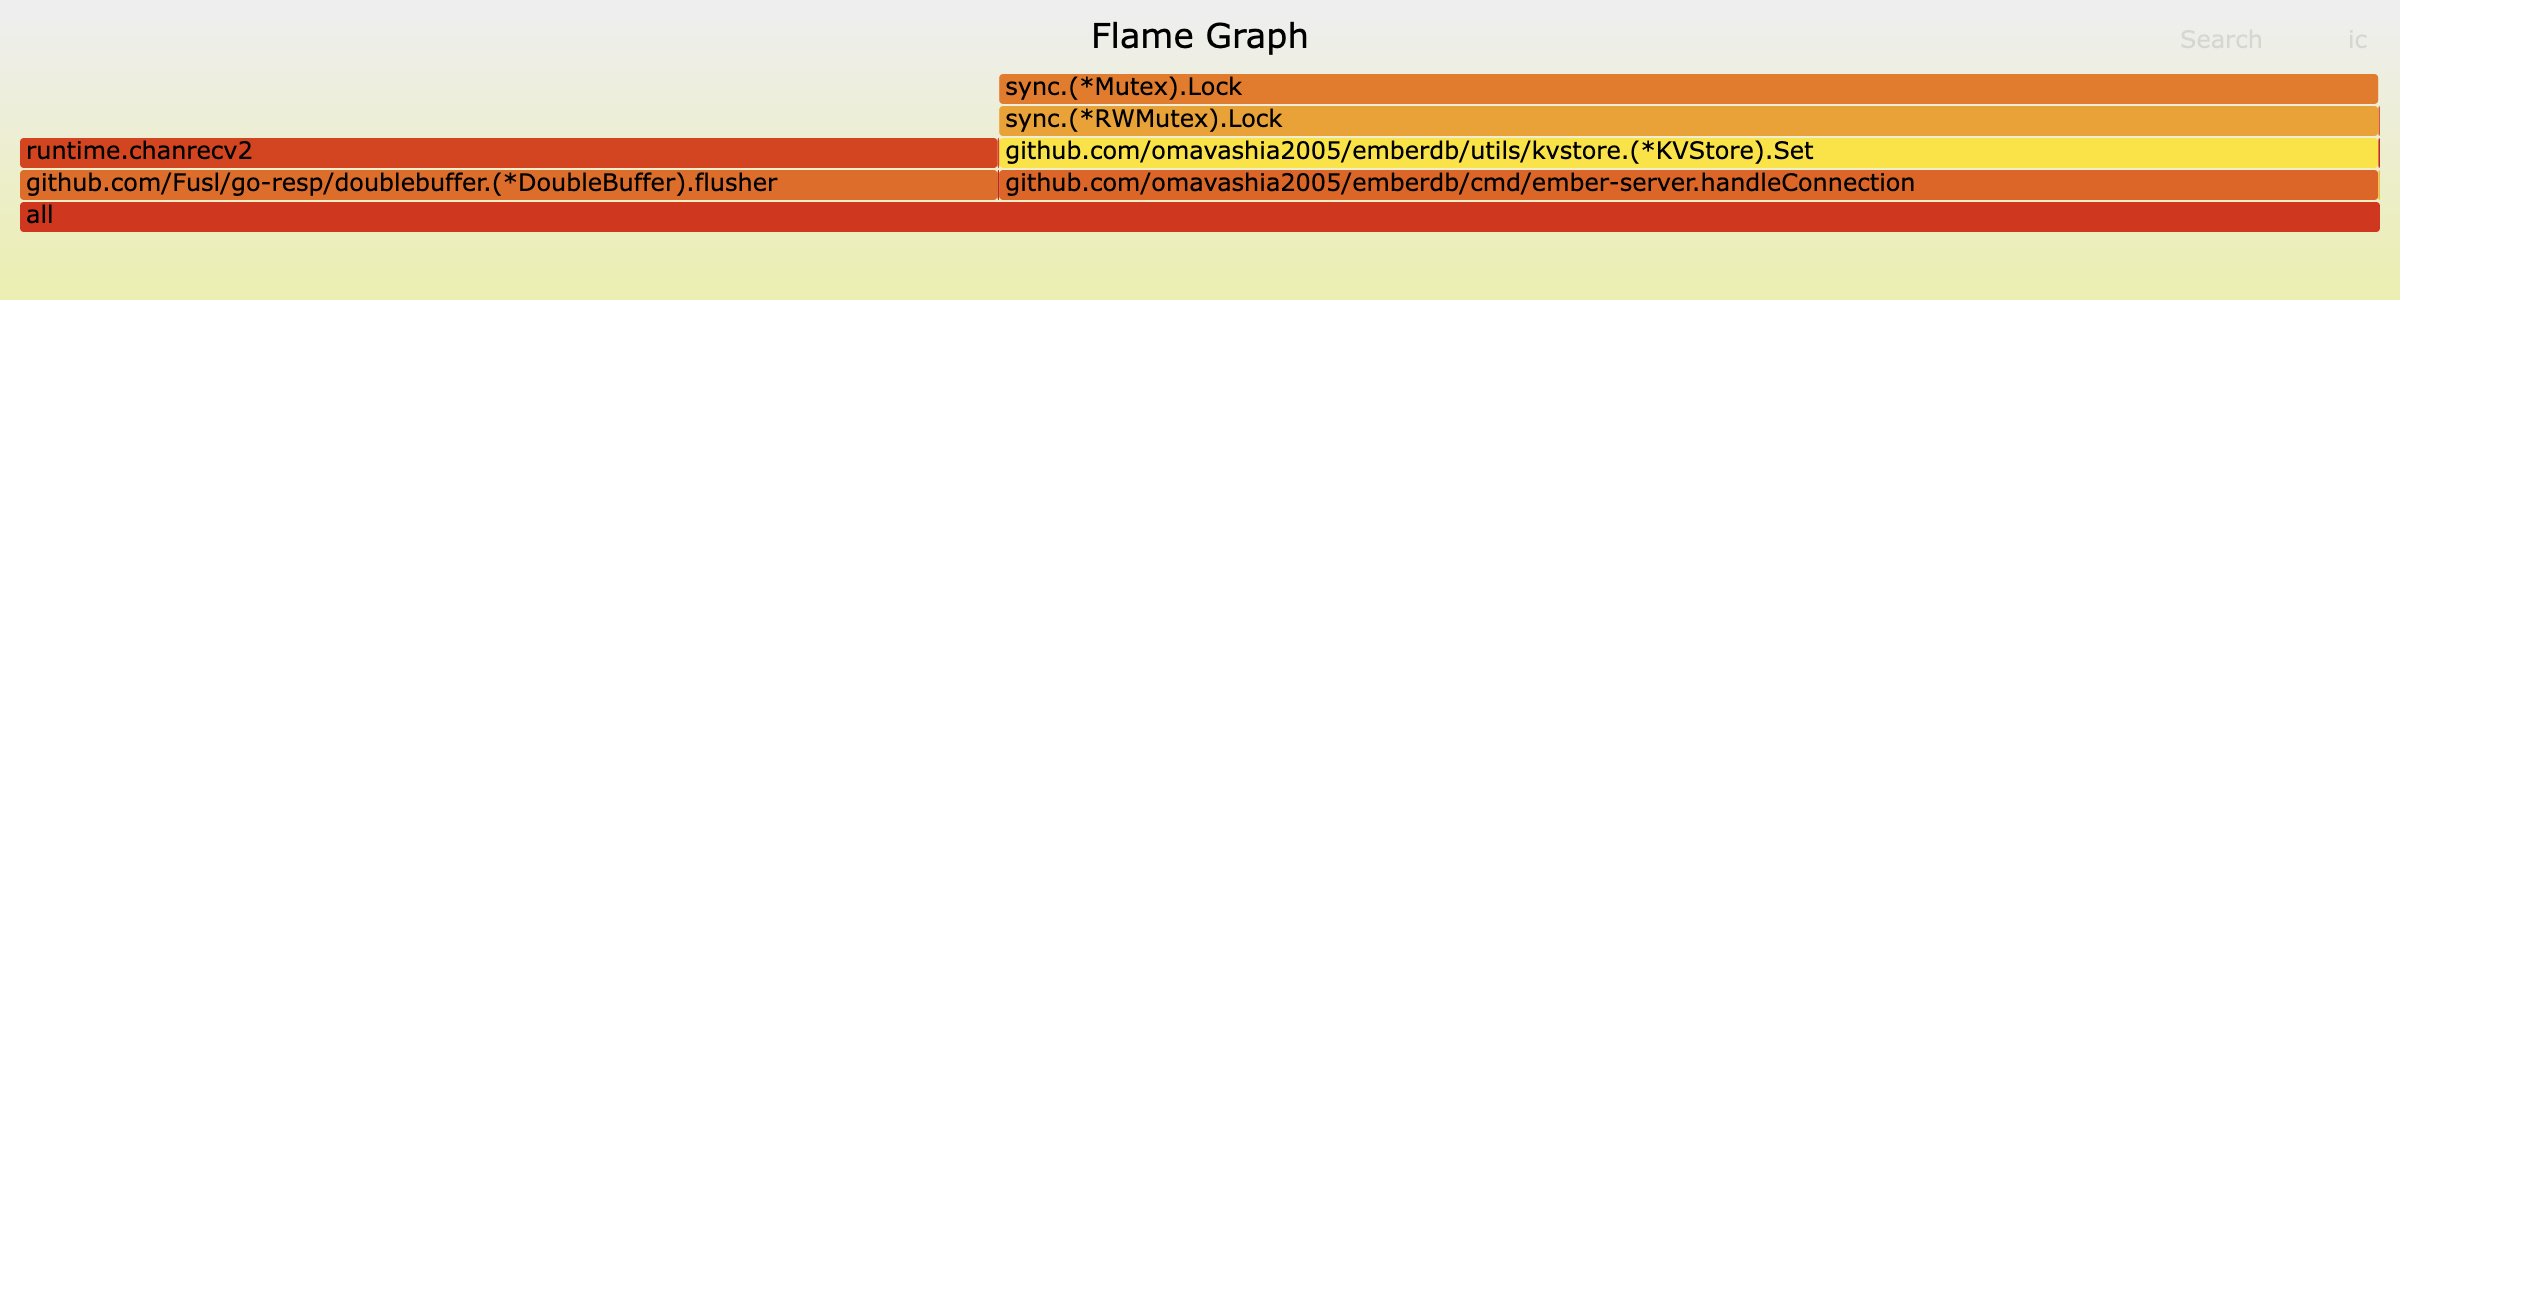
This is the same CPU profile as before, viewed as a flame graph. When I run MSET, the CPU spends a lot of its time waiting for a lock to be released.
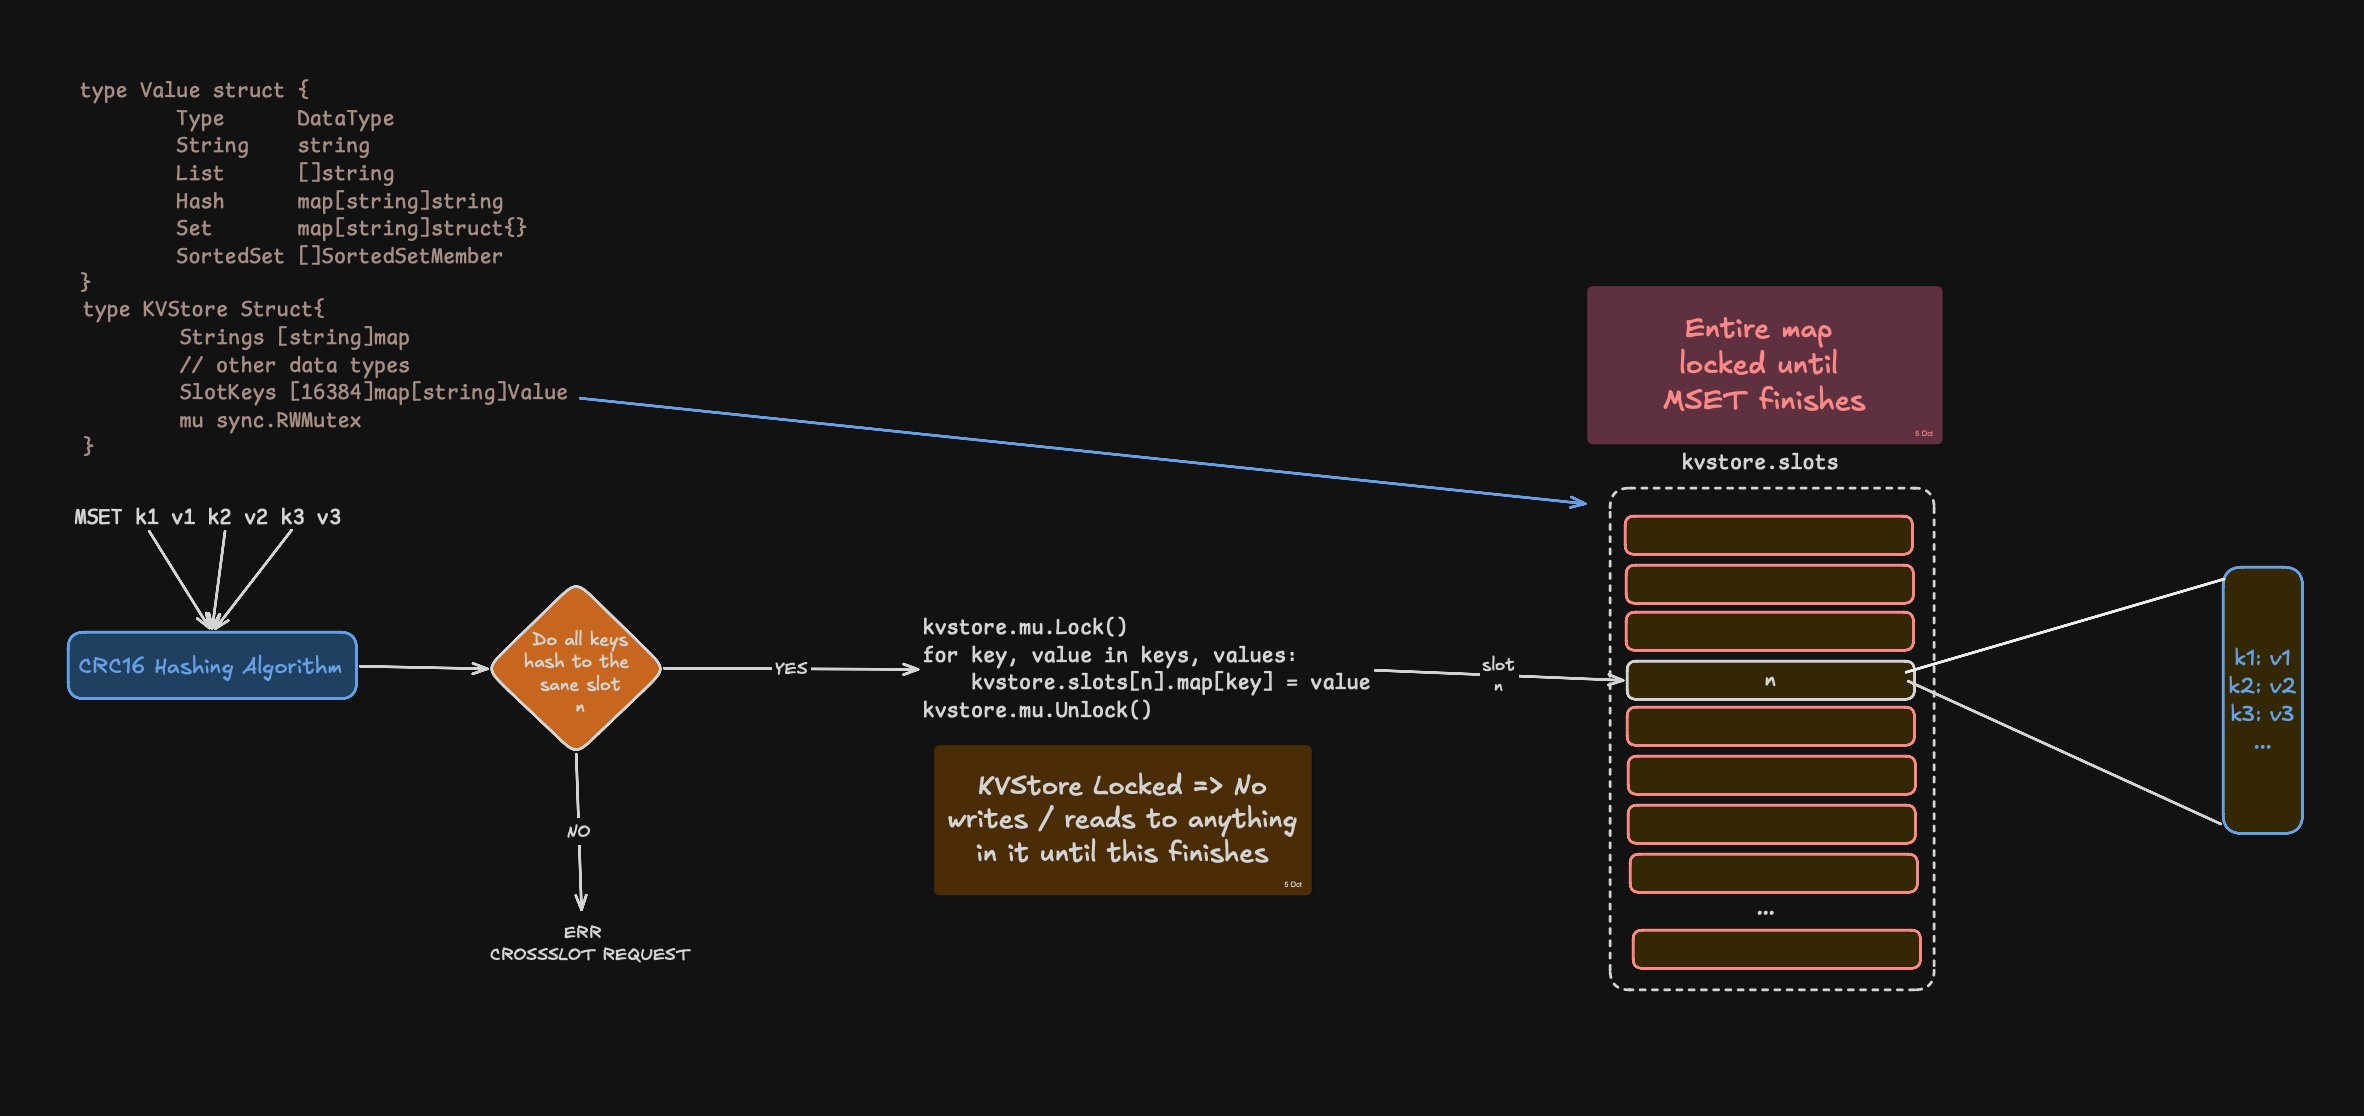
Looking at how I handled MSET made the reason obvious. MSET hashes every key and checks that they all land in the same slot, returning an error if they don't. Then it took a global lock and held it until every key was written. That locks the entire array of slot maps, so no other client can read or write anything until that one MSET finishes. That's exactly the shape in the flame graph, and it's why throughput and latency fell behind Redis.
The fix
After reading a few more blog posts, I realized the data structure was already right. I only needed a lock per shard in place of one global lock. It came out to about 10 to 15 lines of code that I had to propagate through the codebase.
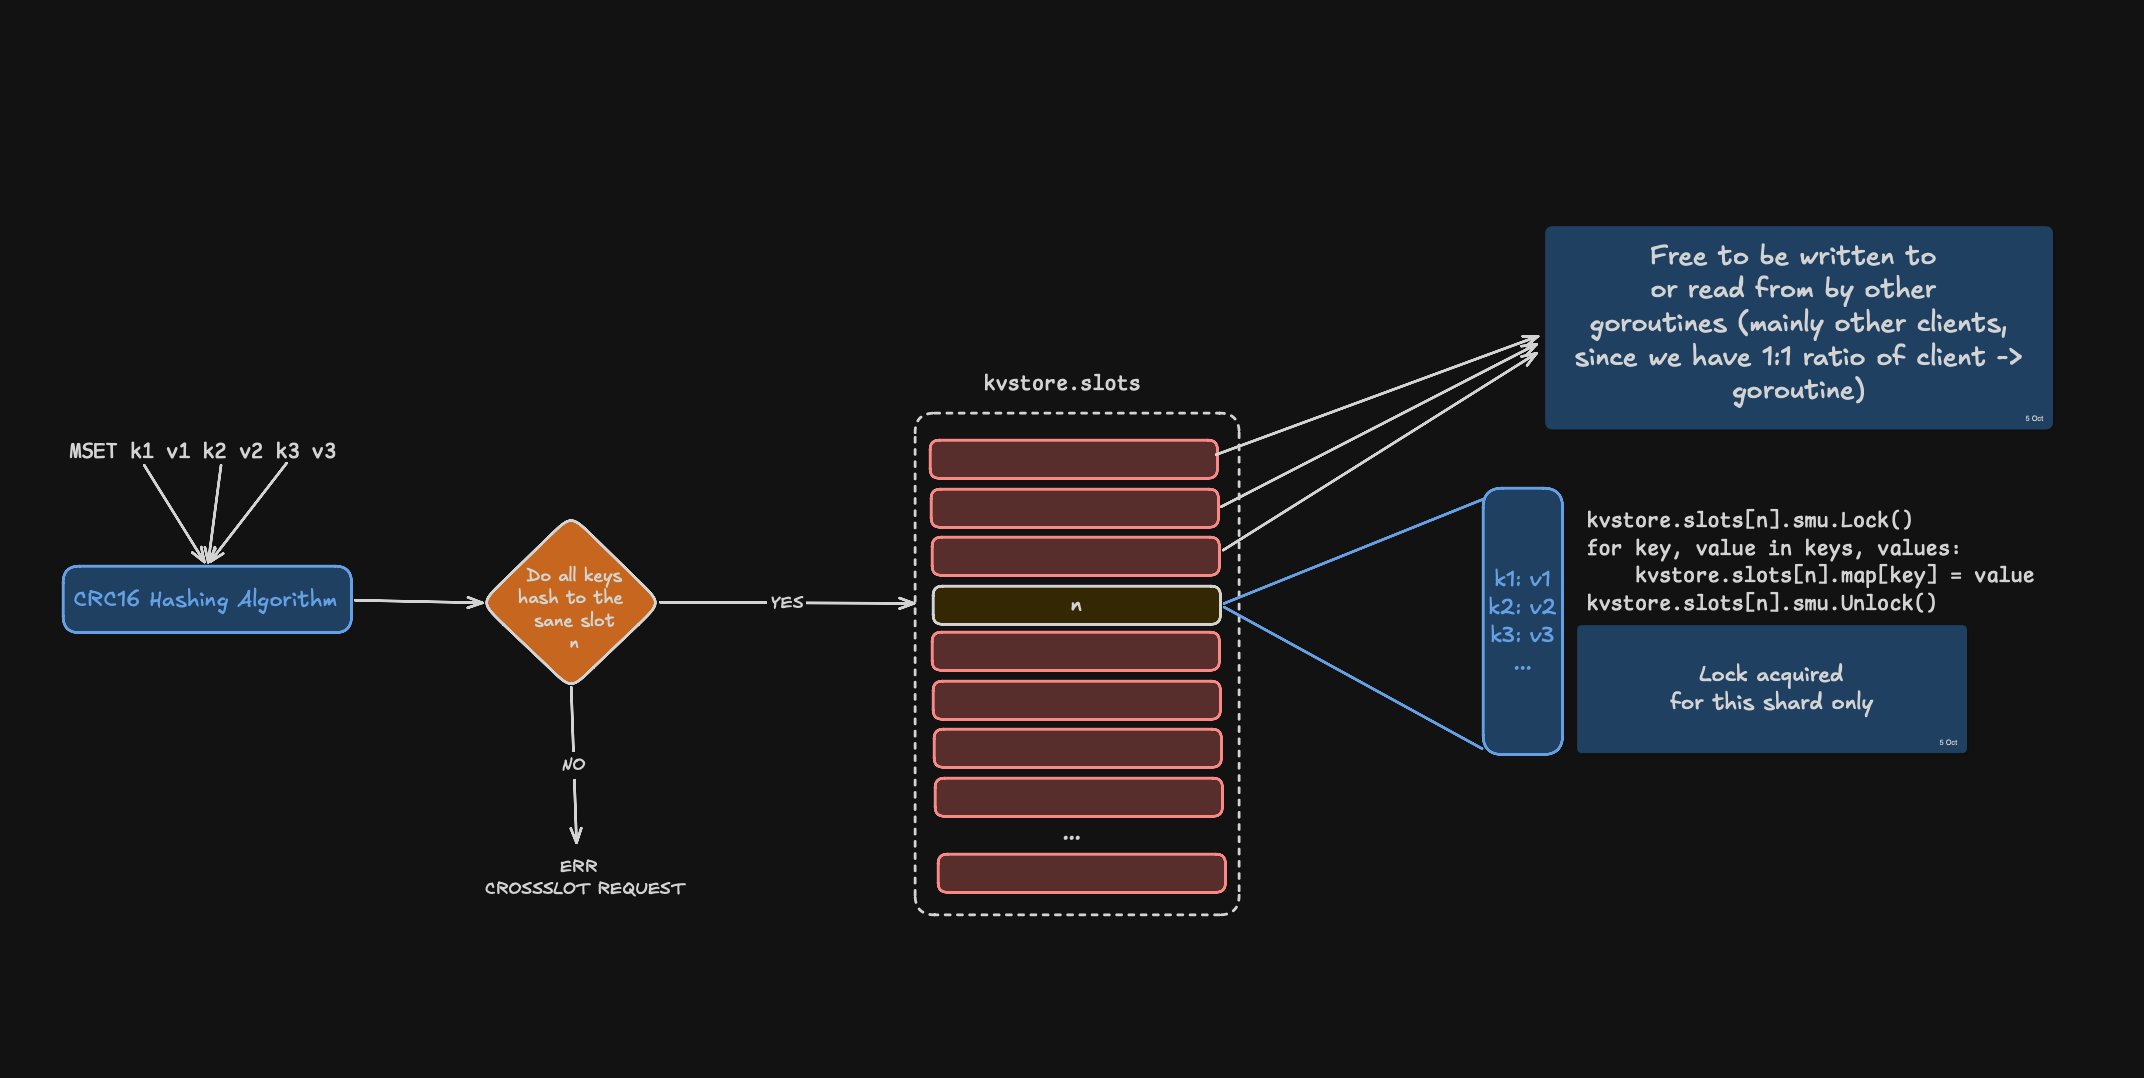
Each slot is now its own map with its own lock. Since Ember runs one goroutine per client connection, an MSET only locks the one shard its keys belong to, and every other client's goroutine can keep reading and writing the rest.
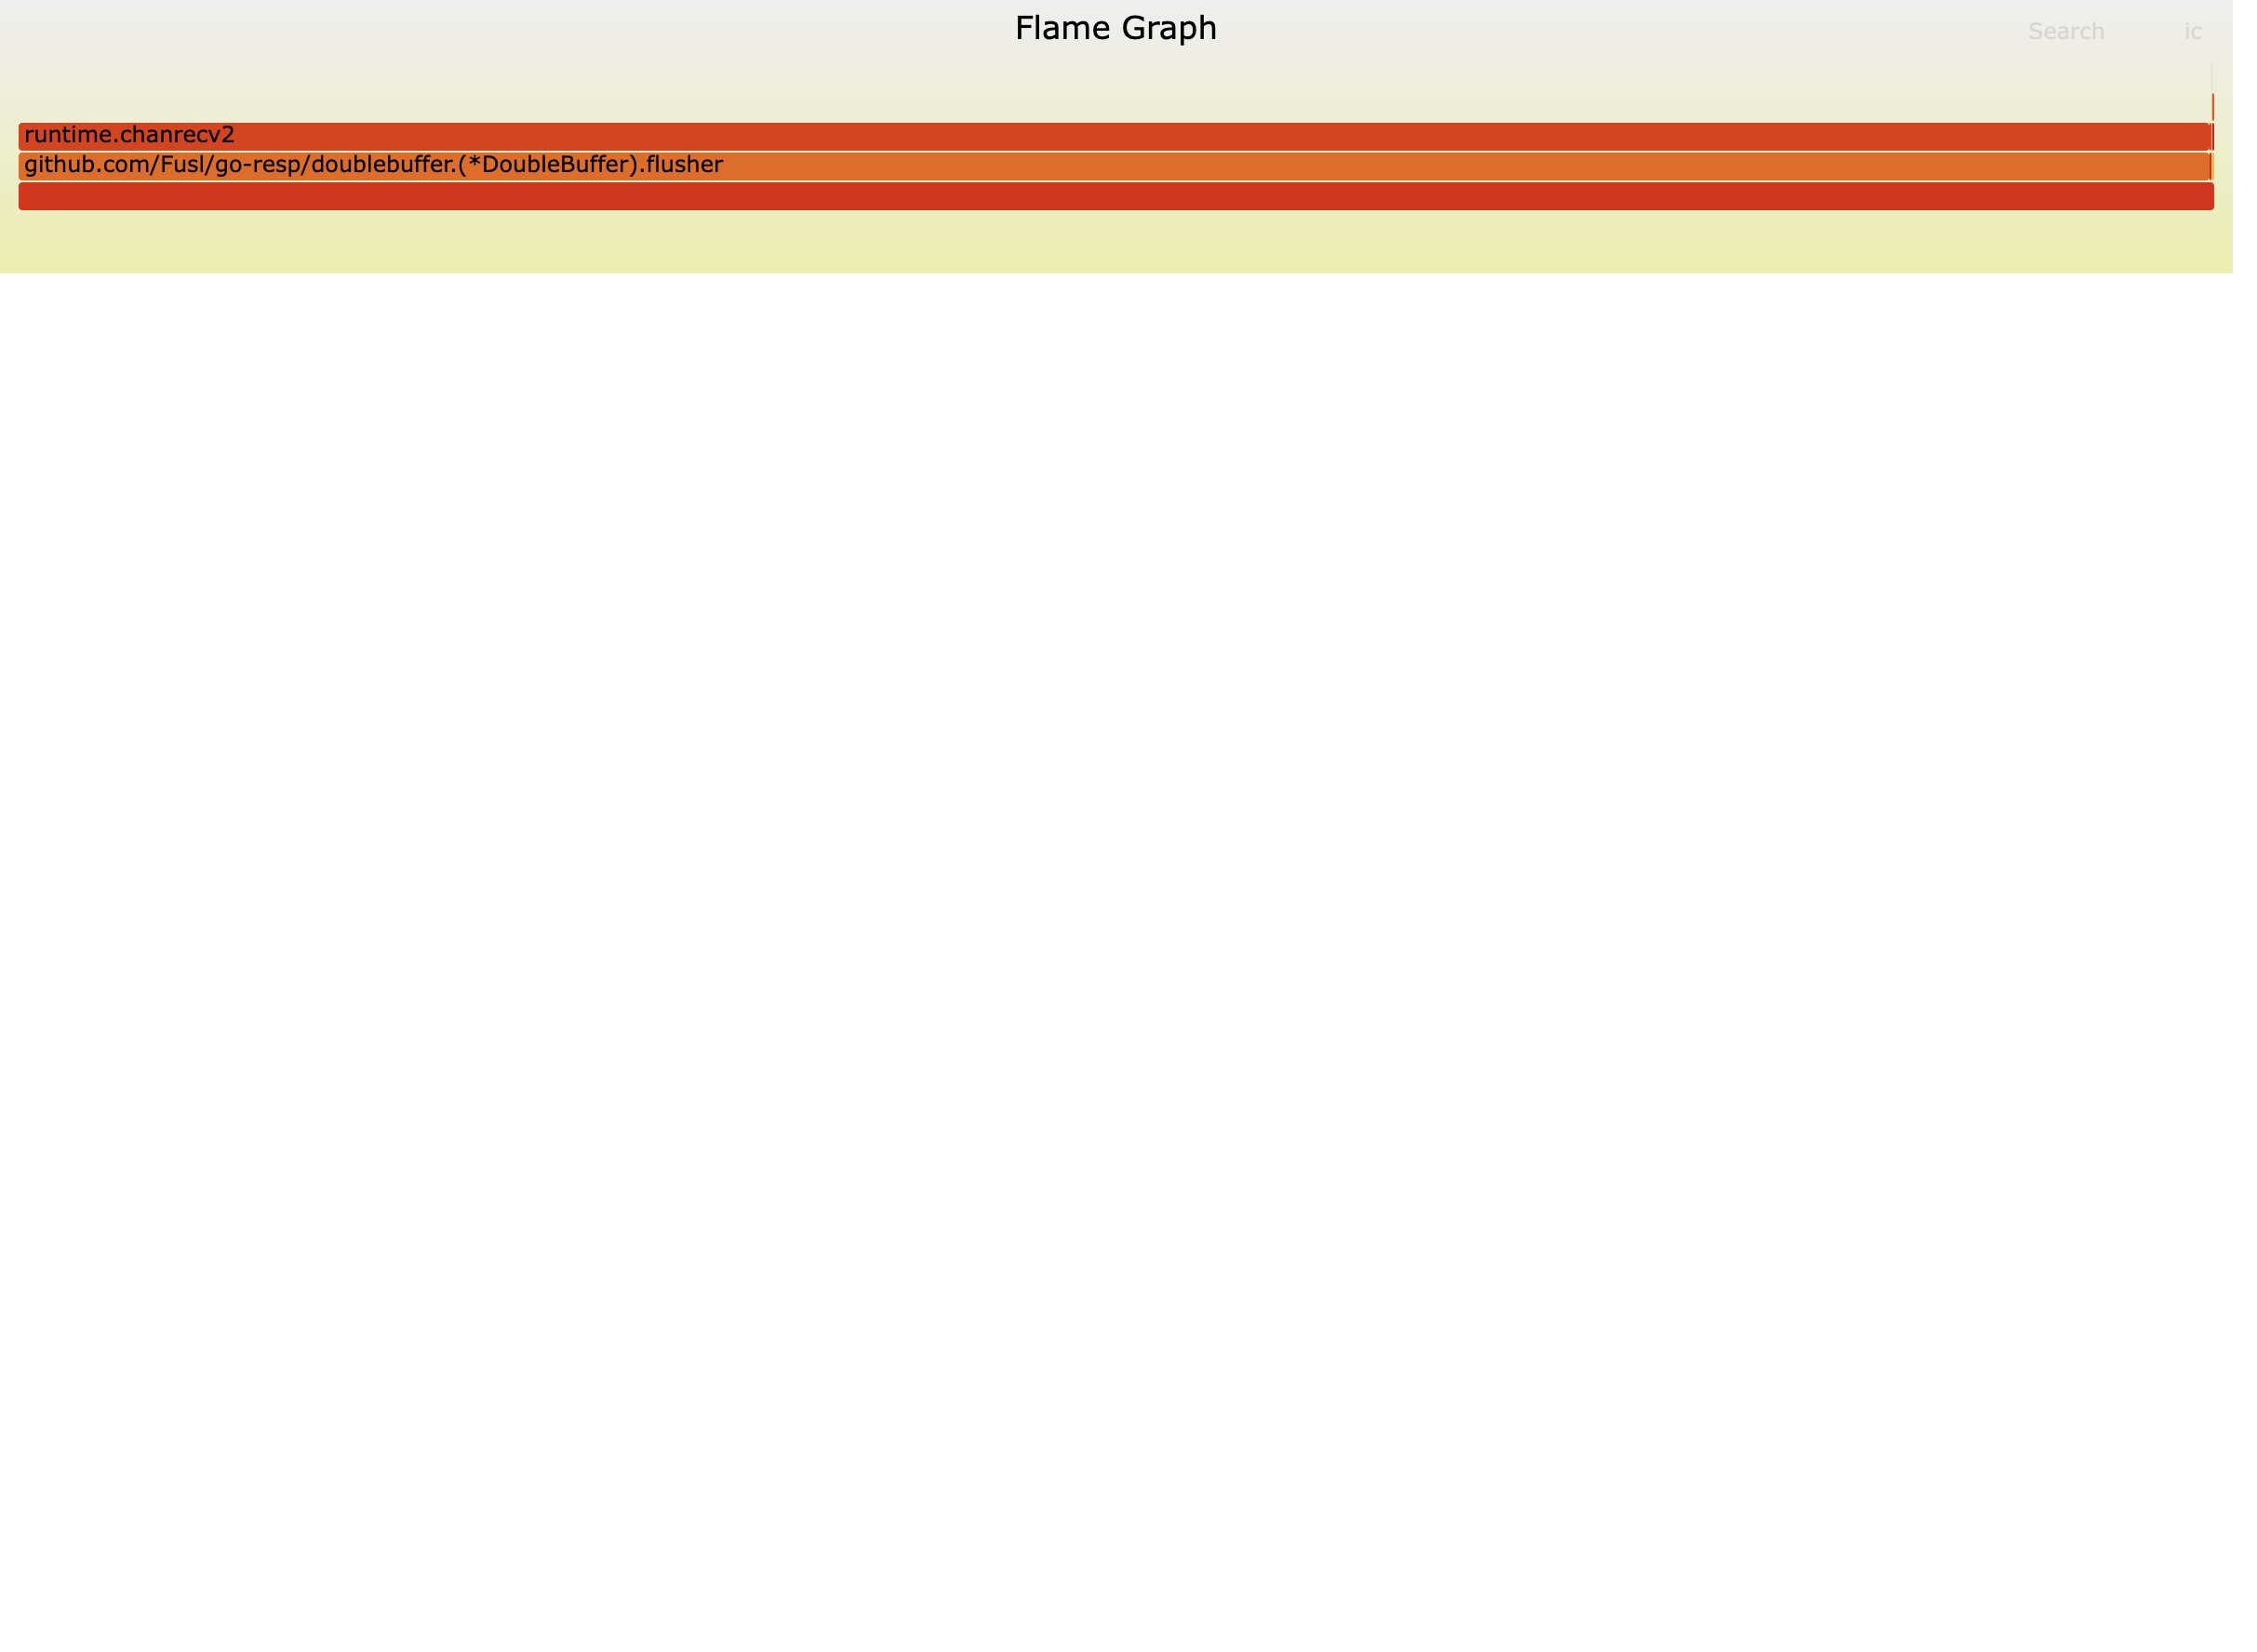
The lock-wait frames are basically gone. The big remaining chunks of CPU time are the flusher (the write syscall from earlier) and a channel, and both come from the goroutine-per-connection design, which I'm not changing for now.
Results
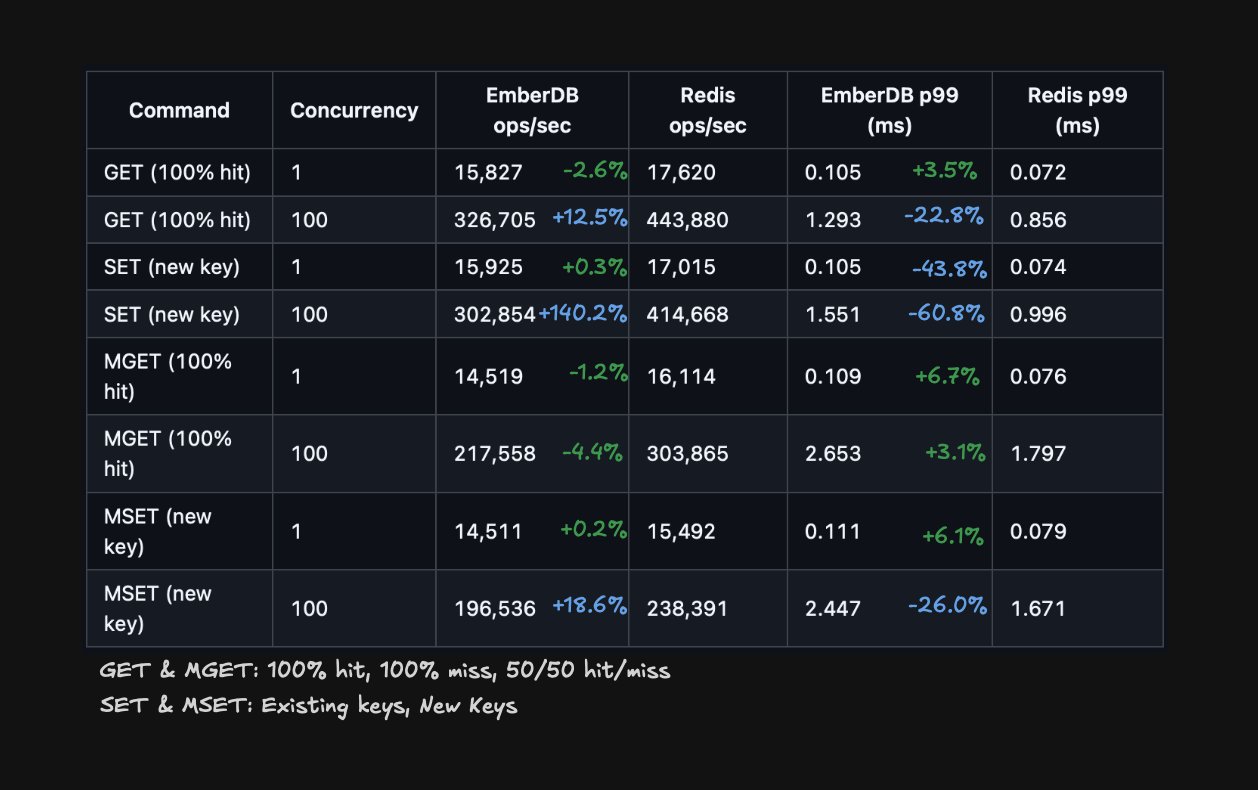
SET throughput is up 140%, and MSET is up almost 19%. GET regressed a little, which I think is noise from the same-machine setup I mentioned earlier. Latency dropped a lot for SET and GET under concurrent load, with a 60.8% reduction at 100 clients, down to about 1.5ms.
What I learned
This project taught me why lock contention is such a big deal. Every cycle a goroutine spends waiting on a lock could go to actual work, and picking the right data structure (and the right lock granularity on top of it) is how you get those cycles back. I care about correctness and speed equally, and per-shard locks gave me both here because MSET still has to keep every key in one slot.
It took me about a week to get here, and I had a lot of fun doing it.
GitHub: github.com/omavashia2005/emberdb